Monitoring system
StatsD Protocol
What is StatsD?
StatsD is a very simple server daemon which collects data from your systems. It happily collects as much data as you want to send it, aggregates it into a few different views and intermittently flushes it out to your backend service - in this case Graphite. When you want to create a new metric, you just send it on and StatsD happily creates it.
Why use StatsD
Let’s take the example that you have a very busy site sending data every time a user does something interesting on the site. If your site activity were to grow linearly, so would the data sent to your measurement system - and soon you might end up in a situation where you’re overwhelming it. One of the useful things StatsD can do is to sample data; by sending only a percentage of the requests you get a lot less data sent while still capturing an accurate view of the system.
Architecture
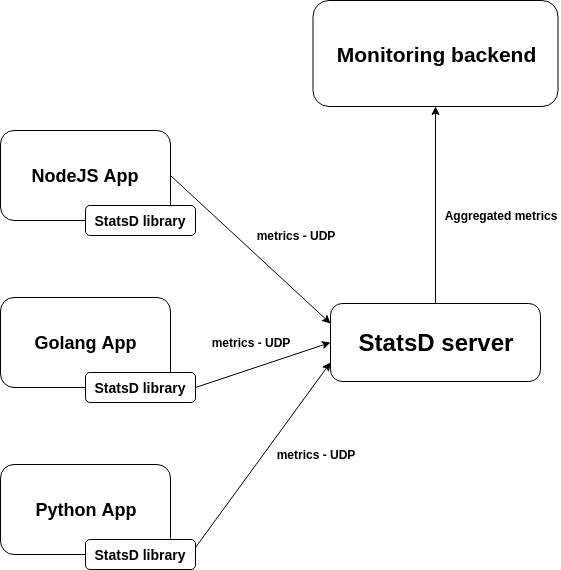
Source: Monitoring StatsD: metric types, format + code examples
This architecture allows the StasD server to be written in any language. It also allows decoupling the behaviour of your application from the monitoring server, making any of these parts easily replaceable or updatable without interfering with the application code that your developers need to maintain. But it has some drawbacks:
- You need to inject the minimum network configuration required to find the StatsD server. This means dealing with volatile IPs, network segmentation and routing, firewalls, etc.
- The information about which entity (host, pod, container, process) originally sent the metric is lost unless you format the metrics to explicitly store this data.
- [Warning]This is especially problematic if you want to deploy containers and microservices, where the software entities are volatile by nature and you need to group them by functionality (for example Kubernetes deployments and services) to make sense of the data.
- The StatsD server becomes a single point of failure. If it crashes, all the monitoring process is temporarily down and the UDP packages for that period are lost.
Collectd
StatsD is good when you are developing the app by yourself or when the application already supports StatsD. But what if you want to send metrics for CPU, network or memory usage? Also, how would you track metrics for PostgreSQL or NGinx?
In these cases, collectd is what we need.
CollectD is an open-source daemon that collects system and application performance metrics on Unix-like systems. It implements ready-to-use metrics from a wide variety of plugins. Just define plugins you need (e.g. CPU, load, processes, df, disk, network, memory, rrdtool, apache, Nginx, MySQL, PostgreSQL, bind, java, Memcached, etc.) and configure them (/etc/collectd/collectd.conf).
It is commonly used for monitoring and performance analysis, and it can work in conjunction with visualization tools like Graphite, Grafana, or InfluxDB to present and analyze the collected metrics.
Architecture
Many common monitoring stacks combine several components together. A collectd, Graphite and Grafana combination is an example of such. collectd is the collector, pulling data from the kernel and third-party applications such as MySQL. To collect custom metrics from your own applications, you'd use the StatsD protocol, which sends user data protocol (UDP) packets to collectd for individual events. collectd sends metrics to Carbon, which uses a Whisper database for storage. Finally, both Graphite and Grafana themselves can be used for visualization.
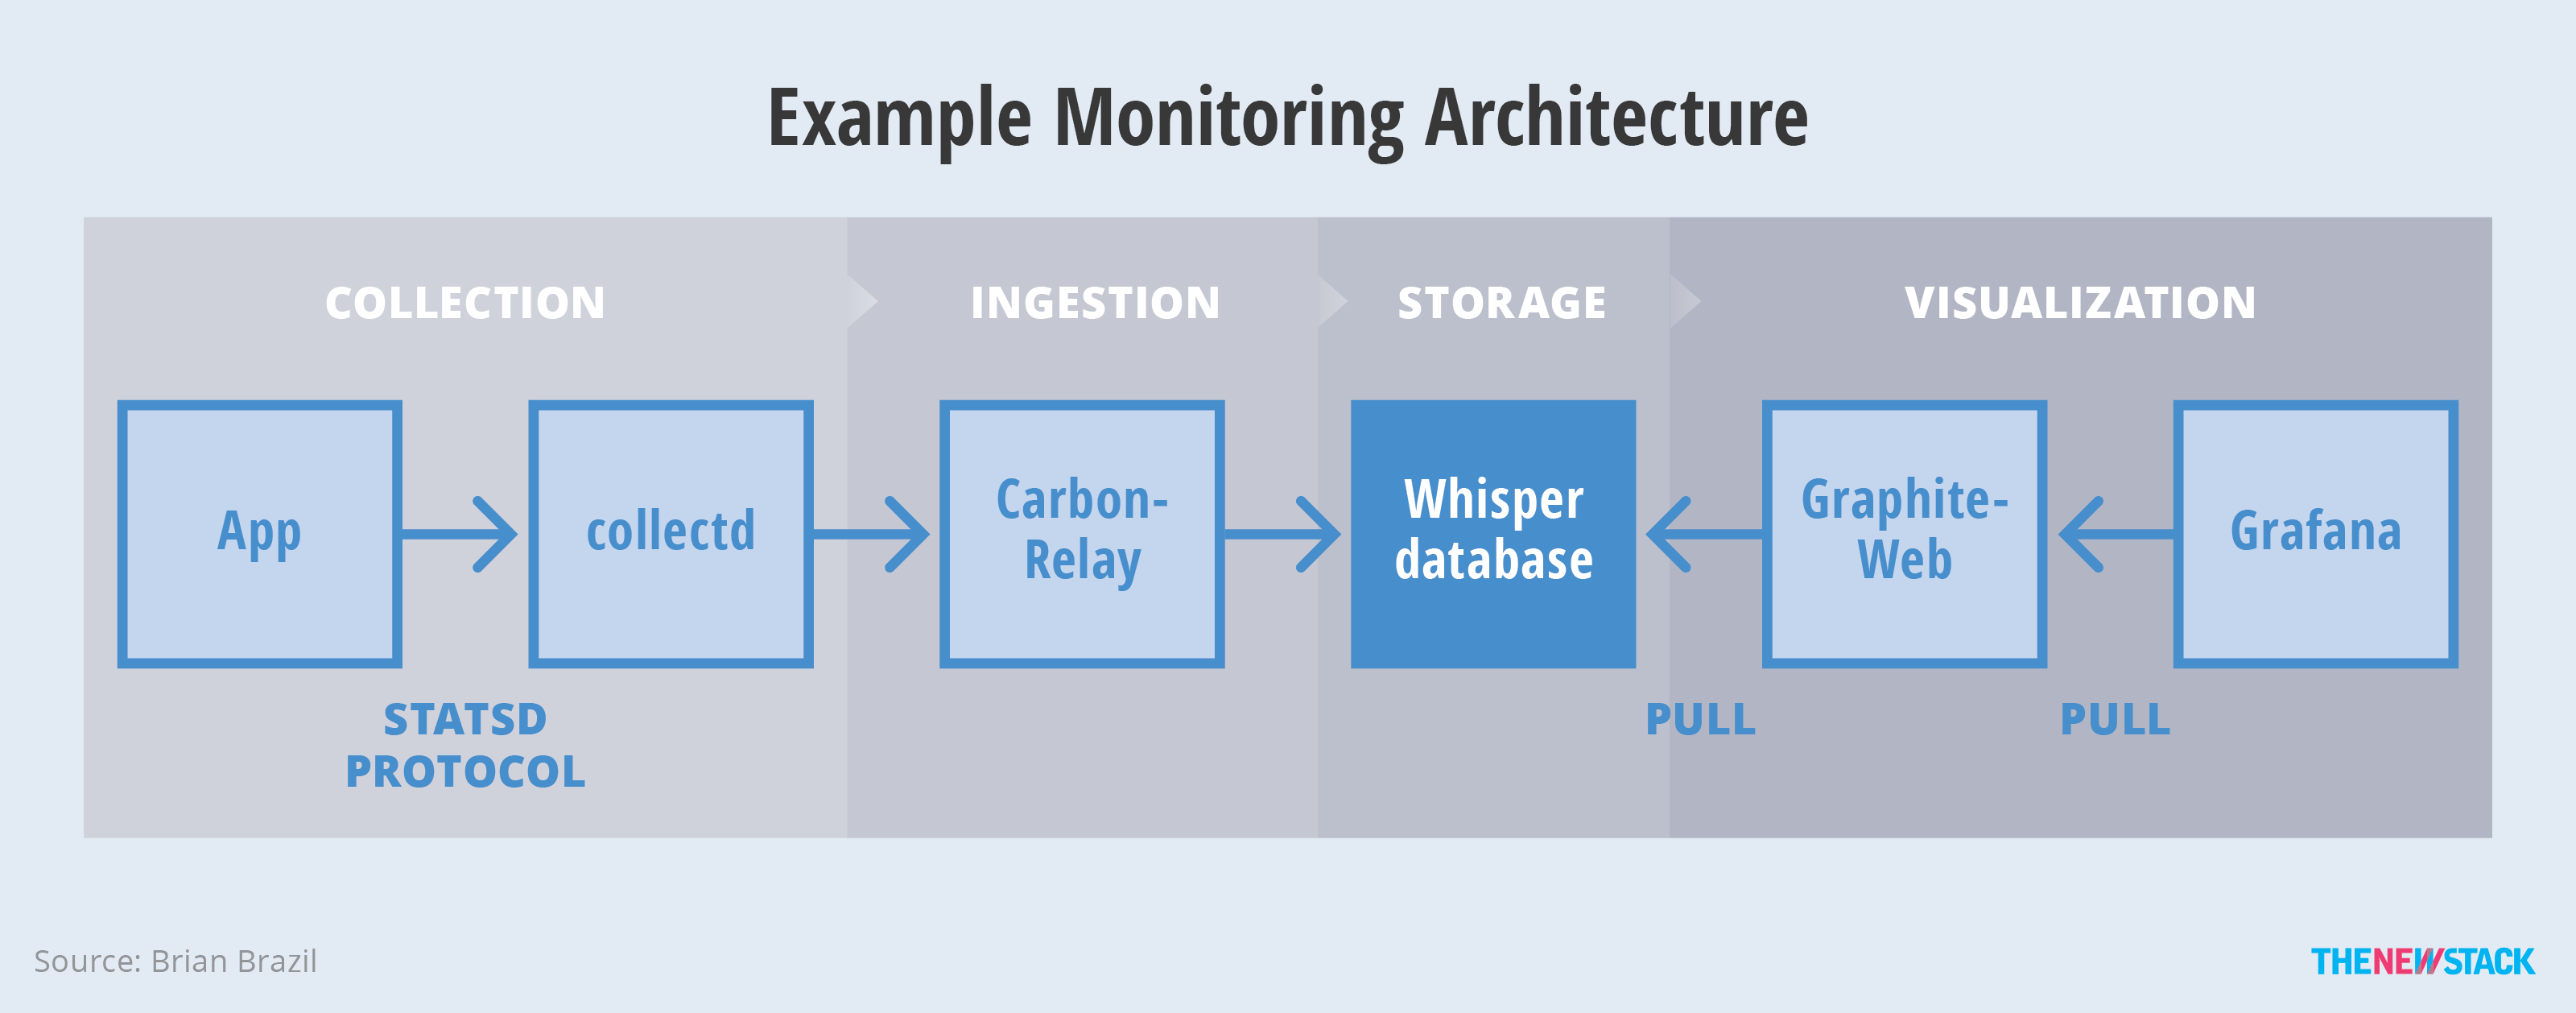
Source: The Classes of Container Monitoring
An example monitoring stack composed of collectd, Graphite, Grafana. The StatsD approach to collection is limiting in terms of scale; it’s not unusual to choose to drop some events in order to gain performance. The collectd per-machine approach is also limiting in a containerized environment. For example, if there are MySQL containers dynamically deployed, then the per-machine collectd needs its configuration updated each time.
Prometheus
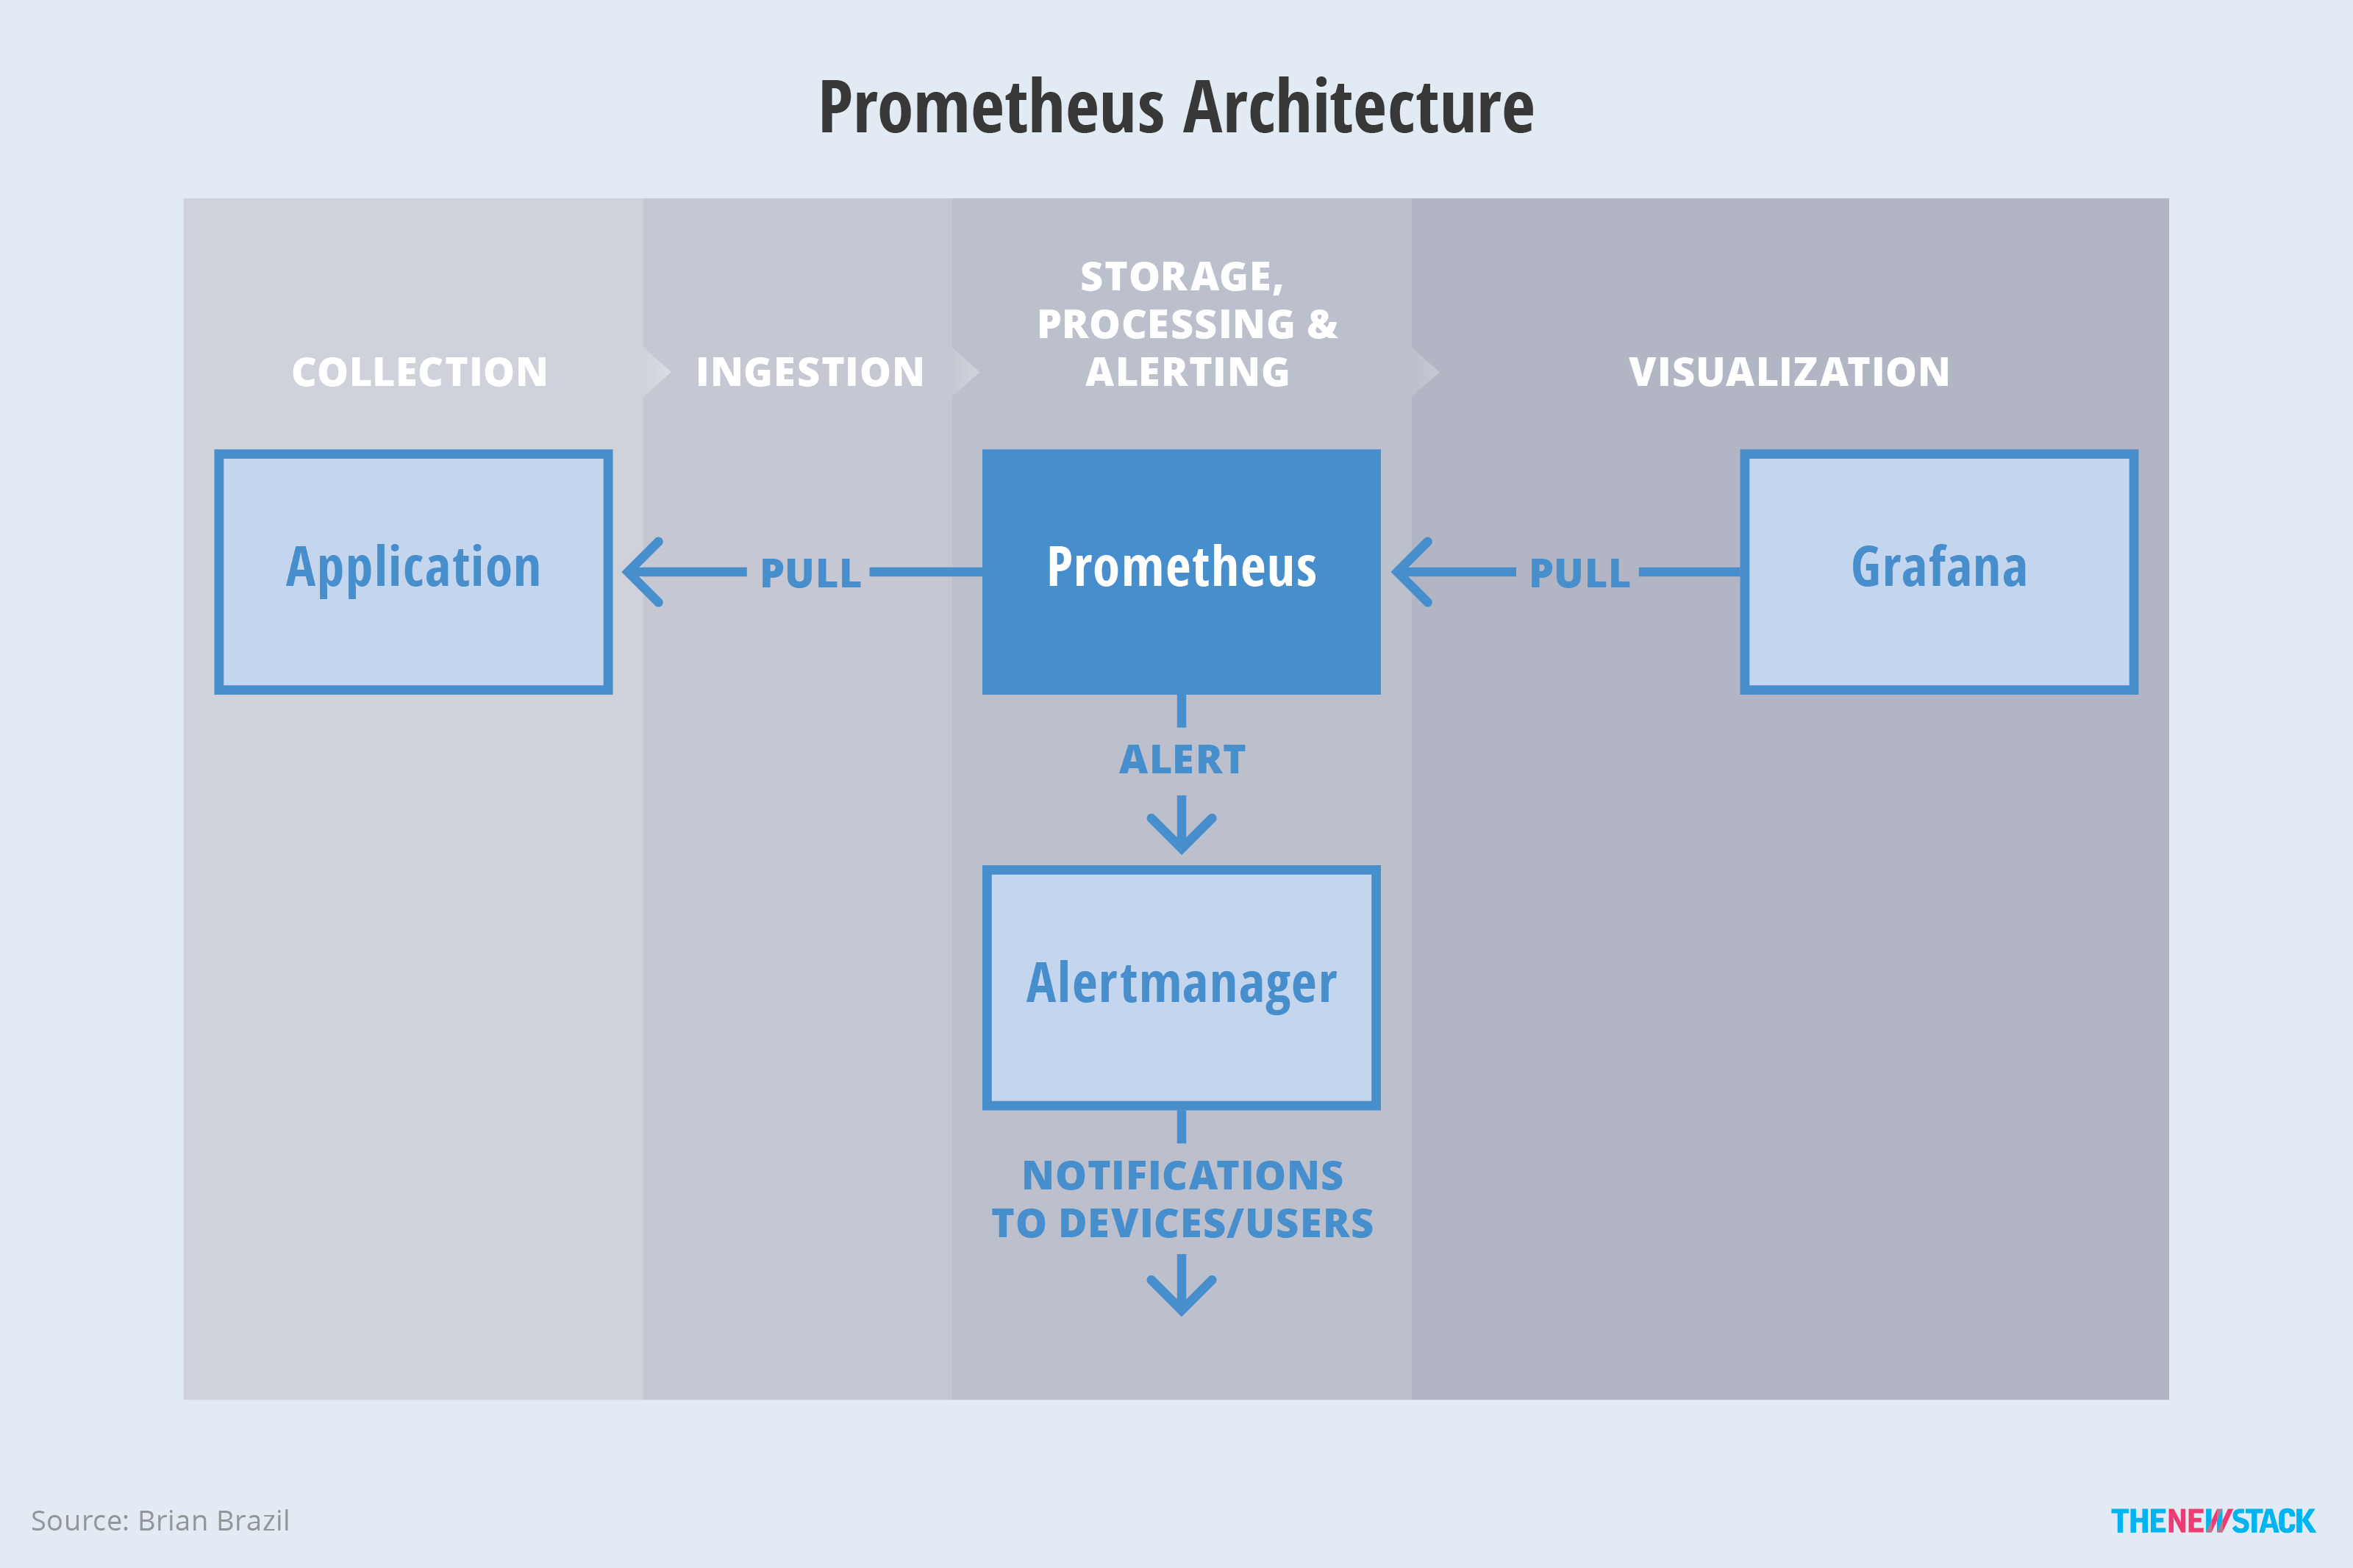
Prometheus takes a different approach than our previous examples. Collection happens where possible inside the application. For third-party applications where that’s not possible, rather than having one collector per machine, there’s one exporter per application. This approach can be easier to manage, at the cost of increased resource usage. In containerized environments like Kubernetes, the exporter would be managed as a sidecar container of the main container.
The Prometheus server handles ingestion, processing, alerting and storage. However, to avoid tying a distributed system into critical monitoring, the local Prometheus storage is more like a cache. A separate, non-critical distributed storage system handles longer term storage. This approach offers both monitoring reliability and durability for long-term data.
Source: The Classes of Container Monitoring
Figure 5: Metrics handling in Prometheus. While Prometheus decides what alerts to fire, it does not send emails or pages to users. Alerts are, instead, sent to an Alertmanager, which deduplicates and aggregates alerts from multiple Prometheus servers, and sends notifications.
Prometheus Architecture
Source: Kubernetes Monitoring: Install Prometheus and Grafana using Helm
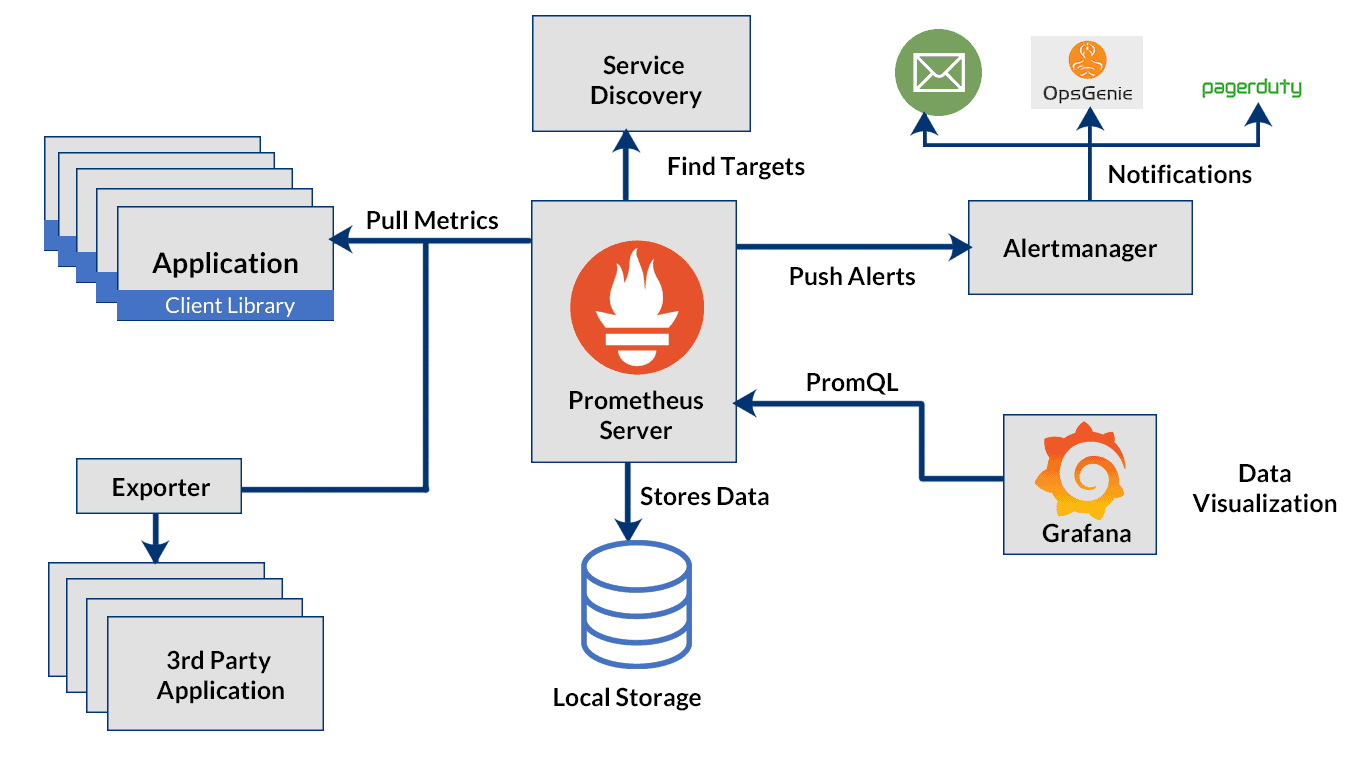
At its core, Prometheus has a main component called Prometheus Server, responsible for the actual monitoring work. The Prometheus server consists of:
- Time Series Database that stores all the metric data like current CPU usage, memory usage etc.
- Data Retrieval Worker is responsible for all the data pulling activities from applications, services, servers etc. and pushing them into the database.
- HTTP Server API meant to accept queries for the stored data. The Server API is used to display the data in a dashboard or a Web UI.