Asset distribution
There are 3 steps in order to execute the asset distribution plan.
- Establishing the Plan: Similar to planning a journey, understanding one's current financial situation, future goals, and risk tolerance is crucial.
- Execution: Once the plan is set, the next step involves executing it by adhering to the calculated allocation percentages for different assets. It highlights the significance of consistent monthly savings and investing according to the pre-determined plan.
- Maintaining the Plan: Regularly reviewing and rebalancing the investment portfolio is essential. For instance, during market fluctuations, it might be necessary to adjust the allocation by selling high-performing assets and buying others to maintain the desired balance.
- For instance, if the stock market surges in a particular year and causes your stock allocation to rise from 80% to 90%, it implies a decrease in bond allocation from 20% to compensate. By year-end, you'd need to rebalance by selling some stocks and using those funds to buy bonds, ensuring the portfolio distribution returns to an 80-20 split.
Asset distribution
Source: 如何計劃資產配置? 創造穩定現金流 💵 #長線投資
To keep our asset distribution simple, we're only considering investments in stocks and bonds. However, in reality, you can also invest in commodities, real estate, or allocate a portion for trading, aiming for higher returns. Right now, though, let's focus solely on stocks and bonds. If we invest in these assets, what kind of returns can we expect? This relies on historical performance. While past events might not dictate the future in investments, having observed one or more economic cycles—bull and bear markets—provides confidence. The historical performance tends to repeat itself.
Stock
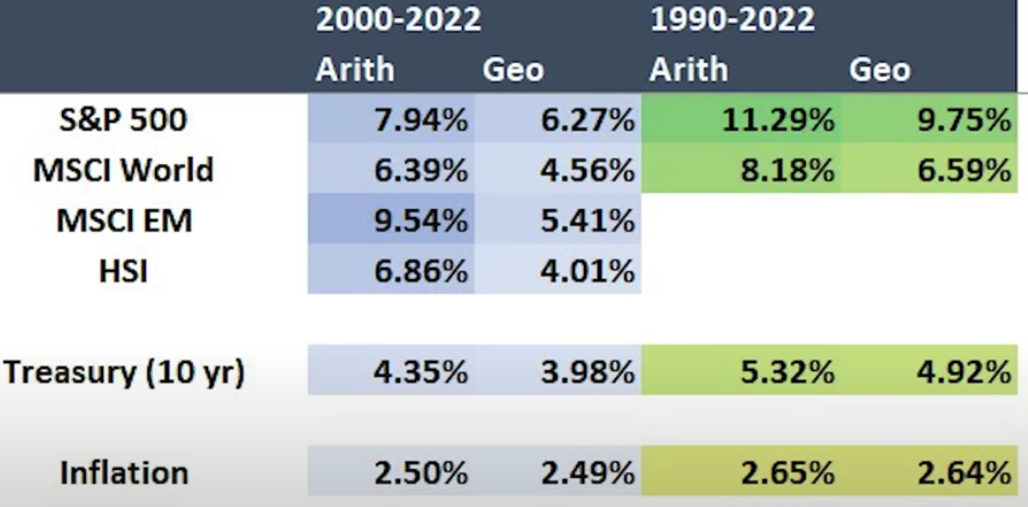
For instance, looking at the S&P index from 2000 to 2022, the average annual return was 7.9%. That's the arithmetic mean, the number most people associate with "average." But if we consider the geometric mean, incorporating the effects of compounded growth, the average return drops a bit to 6.3% per year. Geometric means are typically lower than arithmetic means, especially for more volatile assets.
Then, if we expand our historical view, from 1990 to 2022, the S&P averaged an annual increase of 11.3%. Its geometric mean stood at 9.8%. How about other markets? The MSCI World Index, comprising stocks worldwide, averaged 6.4% from 2000 to 2022, with a geometric mean of 4.6%. Now, turning to the MSCI Emerging Markets Index, it's noteworthy. Its average annual return is 9.5%, higher than the S&P 500, but its geometric mean is lower at 5.4%.
This illustrates the importance of an asset's volatility due to the compounding effect. If an asset or portfolio is too volatile, it can negatively impact wealth accumulation. For instance, consider an extreme example: an asset gaining 200% in the first year and losing 100% in the second. The arithmetic mean would suggest an average increase of 50% ((200-100)/2 = 50%), which sounds promising. However, in reality, the actual return is 0 due to the geometric mean's calculation.
HSI
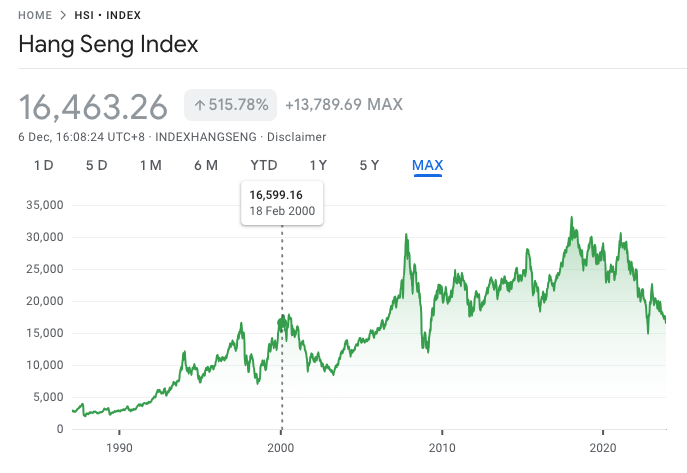
Looking further into historical returns, the Hong Kong market averaged a 6.9% increase from 2000 to 2022. You might find this surprising, considering the Hang Seng Index moved from around 17,000 points in 2000 to just 20,000 points by the end of 2022, marking a 17% increase over more than 20 years. This discrepancy arises from how investment returns include dividends. The Hang Seng Index, if considering only the index numbers, excludes dividend income. Given the historically high dividends from many bank stocks, around 4%, and notably higher in the past, like when HSBC was a major component at 7%, this impacts the calculated returns.
Bond
Shifting to bond returns, the average return for the US ten-year treasury bonds was 4.4% from 2000 to 2022 and 5.3% from 1990 to 2022. Bonds exhibit slightly lower differences between arithmetic and geometric means due to their lower volatility. Noticeably, bond returns have been decent, even amid events like the 2008 financial crisis and subsequent years of quantitative easing (QE), which lowered returns. Despite that period, from 2000 to 2022, bonds still averaged a 4% return, while historically, bonds have provided around a 5% return. Finally, the last row represents the inflation rate: approximately 2.5% over the last 20 years and around 2.6% over the last 30 years.
Stock allocation
A simple approach is to subtract your age from 110. That number represents the portion of your investments that should be in stocks. For instance, if you're 40 years old, 110 minus 40 equals 70, indicating that 70% of your portfolio should be in stocks. However, this is just a basic guideline. Everyone's financial situation and goals differ.
Some individuals with high incomes might not need to invest as much in stocks. Others, aiming for more post-retirement funds, might choose to invest more.
It's important not to strictly adhere to this rule. For instance, in your 30s, an 80-20 split might work, shifting to 70-30 in your 40s, 60-40 in your 50s, and eventually a 50-50 split and above. Adjustments can be made based on individual circumstances.
All-in Stock market?
You might be wondering, since stocks offer the highest expected returns, why not invest everything in them? It all comes down to how much risk you can handle. It might seem easy to put everything into stocks with an annual return of 7%, but in reality, if all your long-term savings are poured into stocks and there's a market downturn or crash like the financial storm where the S&P index dropped by 60%—similar to recent bear markets like the 35% drop during the 2020 pandemic—you have to ask yourself if you can handle that pressure if it occurs again (which unfortunately it likely will). Would you resist selling all your investments in a panic, only to buy in at higher prices after the rebound? Doing so would lower your returns from the historical 7%.
Your personal situation matters too. If you have financial obligations like a mortgage or a family that relies on you, it might be wiser to take on less risk. Similarly, if retirement is nearing, experiencing a sudden market crash a few years before could significantly impact your savings, especially if you need to withdraw money monthly when the market is down, leaving less capital to grow during the rebound. As retirement approaches, going all in on stocks becomes even less advisable.