CloudWatch
AWS CloudWatch is a comprehensive monitoring and observability service provided by Amazon Web Services. It allows users to collect, monitor, and store various operational data, such as logs and metrics, from AWS resources and applications in one central location. CloudWatch provides insights into system performance, resource utilization, and application behavior, enabling users to troubleshoot issues, set alarms, and automate responses to maintain the reliability and availability of their applications. It's a valuable tool for optimizing resource usage and ensuring the overall health of AWS environments.
Behaviour
- Alarms continue to evaluate metrics against the configured threshold, even after they have already triggered. You can adjust the alarm threshold if you do not want it to be in ALARM state
- CloudWatch also offers a cross-account, cross-Region CloudWatch dashboard. This functionality provides you with cross-account visibility to your dashboards, alarms, metrics, and automatic dashboards. It does not provide cross-account visibility for logs or for traces. For more information, see Cross-account cross-Region CloudWatch console.
Features
Metric Math
Metric math enables you to query multiple CloudWatch metrics and use math expressions to create new time series based on these metrics. You can visualize the resulting time series on the CloudWatch console and add them to dashboards.
CloudWatch Synthetics
You can use Amazon CloudWatch Synthetics to create canaries which is a configurable scripts that run on a schedule, to monitor your endpoints and APIs. Canaries follow the same routes and perform the same actions as a customer, which makes it possible for you to continually verify your customer experience even when you don't have any customer traffic on your applications.
- Canaries are Node.js scripts. They create Lambda functions in your account that use Node.js as a framework. Canaries work over both HTTP and HTTPS protocols.
- UI canaries offer programmatic access to a headless Google Chrome Browser via Puppeteer. For more information about Puppeteer, see Puppeteer.
- Canaries check the availability and latency of your endpoints and can store load time data and screenshots of the UI. They monitor your REST APIs, URLs, and website content, and they can check for unauthorized changes from phishing, code injection and cross-site scripting.
CloudWatch alarm & action
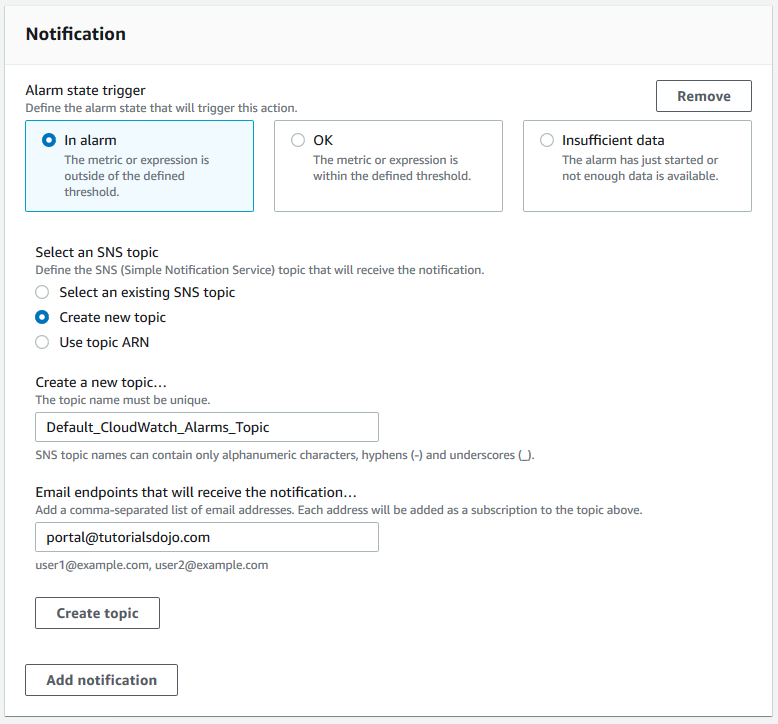
You can create a CloudWatch alarm that watches a single metric. The alarm performs one or more actions based on the value of the metric relative to a threshold over a number of time periods. The action can be..
- an Amazon EC2 action
- an Amazon EC2 Auto Scaling action
- a notification sent to an **Amazon SNS topic **
- creating a Systems Manager OpsItem
Example Alarm & Action for EC2
Setup a CloudWatch alarm to monitor the health status of the instance. In case of an Instance Health Check failure, an EC2 Reboot CloudWatch Alarm Action can be used to reboot the instance
The reboot alarm action is recommended for Instance Health Check failures - The system status check detects issues with the underlying host that your instance runs on. If the underlying host is unresponsive or unreachable due to network, hardware, or software issues, then this status check fails.
The recover alarm action, which is suited for System Health Check failures - An instance status check failure indicates a problem with the instance due to operating system-level errors such as the following:
- Failure to boot the operating System
- Failure to mount volumes correctlySystem
- File system issuesSystem
- Incompatible driversSystem
- Kernel panic
EventBridge Rules
EventBridge was formerly called Amazon CloudWatch Events.
EventBridge detects and react to changes in the state of a pipeline, stage, or action. Then, based on rules you create, it invokes one or more target actions when a pipeline, stage, or action enters the state you specify in a rule.
Examples of EventBridge rules and targets:
- A rule that sends a notification when the instance state changes, where an EC2 instance is the event source, and Amazon SNS is the event target.
- A rule that sends a notification when the build phase changes, where a CodeBuild configuration is the event source, and Amazon SNS is the event target.
- A rule that detects pipeline changes and invokes an AWS Lambda function.
CloudWatch integration
S3 (log data)
You can export log data from your CloudWatch log groups to an Amazon S3 bucket and use this data in custom processing and analysis, or to load onto other systems.
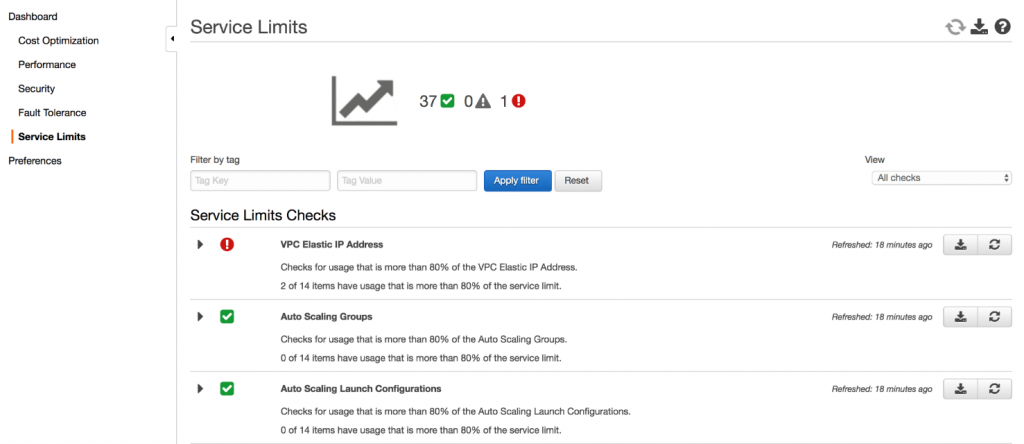
Trusted Advisor(Service limit)
Service limit is a feature provided by Trusted Advisor a reference implementation that automatically provisions the services necessary to proactively track resource usage and send notifications as you approach limits.
Source: Monitoring Service Limits with Trusted Advisor and Amazon CloudWatch
You can use Amazon EventBridge (Amazon CloudWatch Events) to detect and react to changes in the status of Trusted Advisor checks. Then, based on the rules that you create, CloudWatch Events invokes one or more target actions when a status check changes to the value you specify in a rule. Some example service check:
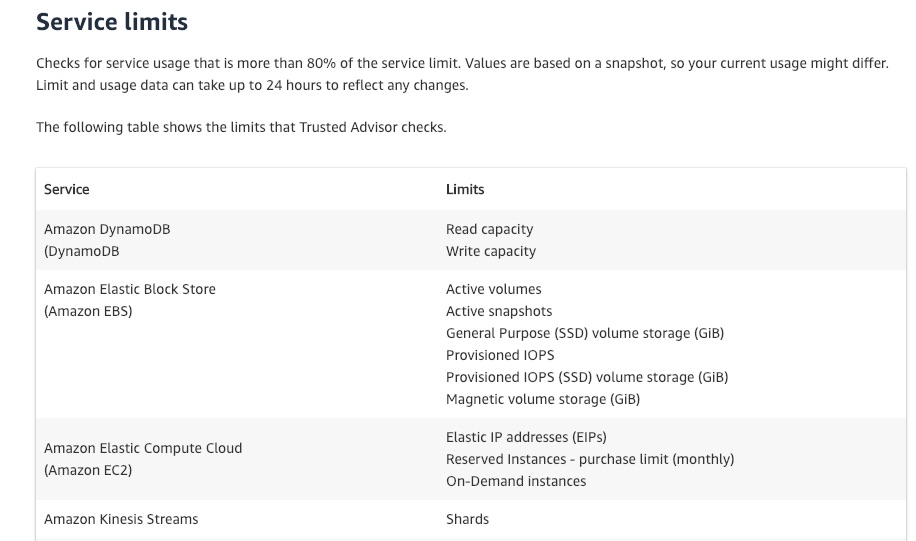
Depending on the type of status change, you might want to send notifications, capture status information, take corrective action, initiate events, or take other actions.
Monitor Trusted Advisor - Service limits AWS trusted-advisor
What is Metrics
Metrics, sometimes called time series, are concerned with events aggregated across time. They count how often each type of event happens, how long each type of event takes and how much data was processed by the event type.
TL;DR - Think Dimension as a label
The key to distinguishing between Metrics with the same Name are Dimensions:
A dimension is a name/value pair that is part of the identity of a metric. You can assign up to 10 dimensions to a metric.
Every metric has specific characteristics that describe it, and you can think of dimensions as categories for those characteristics. Dimensions help you design a structure for your statistics plan. Because dimensions are part of the unique identifier for a metric, whenever you add a unique name/value pair to one of your metrics, you are creating a new variation of that metric.
Metrics for Aurora
AuroraReplicaLagmetric to measure the lag in milliseconds between primary and reader instances. If the number ofAuroraReplicaLagincreases, the data stored in the reader instance will intermittently fall behind the data that's being written in the primary instanceAuroraReplicaLagMaximummetric captures the maximum amount of lag of all types of Aurora Replicas, regardless of the replication mechanism (e.g., standard Aurora replication or Aurora Binlog replication).AuroraBinlogReplicaLagmetric captures the amount of time a replica DB cluster running on Aurora MySQL-Compatible Edition lags behind the source DB cluster. (replica 慢過Aurora source DB 幾多) This metric is useful for monitoring replica lag between Aurora DB clusters that are replicating across different AWS Regions.
Metrics for RDS
Because you don't have direct access to the instances/servers of your RDS database instance, unlike with your EC2 instances where you can install a CloudWatch agent or a custom script to get CPU and memory utilization of your instance.
You can use Enhanced Monitoring feature in RDS to monitor the RDS.
Take note that there are certain differences between CloudWatch and Enhanced Monitoring Metrics when gathering data for RDS. CloudWatch gathers metrics about CPU utilization from the hypervisor for a DB instance, and Enhanced Monitoring gathers its metrics from an agent on the instance. As a result, you might find differences between the measurements, because the hypervisor layer performs a small amount of work.
The differences can be greater if your DB instances use smaller instance classes because then there are likely more virtual machines (VMs) that are managed by the hypervisor layer on a single physical instance. Enhanced Monitoring metrics are useful when you want to see how different processes or threads on a DB instance use the CPU.
Metrics for EC2 & ASG
RAM is NOT included in the AWS EC2 metrics
-
AWS Provided metrics (AWS pushes them):
- Basic Monitoring (default): metrics are collected at a 5 minute internal
- Detailed Monitoring (paid): metrics are collected at a 1 minute interval
- You can aggregate the metrics for AWS resources across multiple accounts and Regions *only if the EC intances have enabled Detailed Monitoring *
- For EC2, below are the metrics that provided by default
- CPU:
CPU Utilization+Credit Usage / Balance - Network:
NetworkInandNetworkOut - Status Check:
- Instance status = check the EC2 VM
- System status = check the underlying hardware
- Disk: Read / Write for Ops / Bytes (only for instance store)
- CPU:
- For ASG, it includes
GroupInServiceInstances,GroupPendingInstance
-
Custom metric (yours to push):
- Basic Resolution (default): 1 minute resolution
- High Resolution: all the way to 1 second resolution
- Include RAM, application level metrics
- Make sure the IAM permissions on the EC2 instance to push the logs and the metrics.
- [Exam]:
put-metric-dataCLI/API- The following command publishes a metric called Buffers with two dimensions named InstanceId and InstanceType:
aws cloudwatch put-metric-data --metric-name Buffers --namespace MyNameSpace --unit Bytes --value 231434333 --dimensions InstanceId=1-23456789,InstanceType=m1.small - Another example:
aws cloudwatch put-metric-data --metric-name PageViewCount --namespace MyService --value 2 --timestamp 2018-10-10-14T08:00:00.000Z
- The following command publishes a metric called Buffers with two dimensions named InstanceId and InstanceType:
Procstat plugin
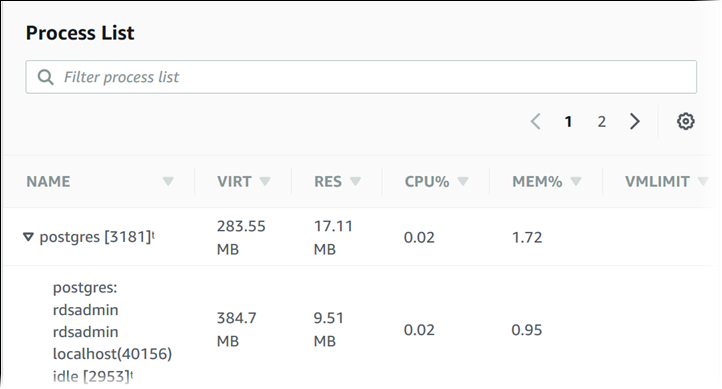
TL;DR - Process-level Monitoring: The plugin enables you to monitor individual processes, allowing you to gain insights into their resource consumption and performance.
The CloudWatch Agent procstat plugin is a component of the CloudWatch Agent provided by AWS. The procstat plugin allows you to monitor and collect metrics from specific processes running on your Amazon EC2 instances.
By configuring the procstat plugin, you can specify the processes you want to monitor and collect metrics for, such as CPU usage, memory usage, or custom metrics exposed by the process. The plugin uses the procfs file system on Linux-based systems to retrieve information about the specified processes.
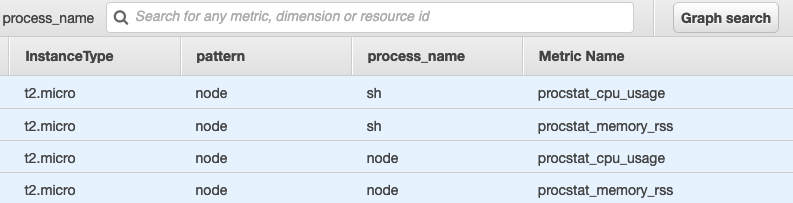
There are three methods to specify the processes to monitor: pid_file, exe, and pattern. Take note that CloudWatch agent can only use one method. If you specify more than one section, the CloudWatch agent uses the pid_file section if it is present. If not, it uses the exe section.
Metrics for SQS
- Amazon SQS sends a number of metrics to CloudWatch, some of which are
ApproximateAgeOfOldestMessage,ApproximateNumberOfMessages,ApproximateNumberOfMessagesDelayed,NumberOfMessagesDeletedand so on - The only dimension that Amazon SQS sends to CloudWatch is QueueName.
You can also use the aws cli, get-queue-attributes to get the SQS mertrics in EC2 or lambda to send a custom metric to Amazon CloudWatch.
aws sqs get-queue-attributes --queue-url https://sqs.<region>.amazonaws.com/<accountId>/<SQS name> --attribute-names VisibilityTimeout ApproximateNumberOfMessages ApproximateNumberOfMessagesNotVisible ApproximateNumberOfMessagesDelayed
{
    "Attributes": {
        "VisibilityTimeout": "60",
        "ApproximateNumberOfMessages": "0",
        "ApproximateNumberOfMessagesNotVisible": "3",
        "ApproximateNumberOfMessagesDelayed": "0"
    }
}
Unified CloudWatch Agent
"AWS Unified CloudWatch Agent" and "AWS CloudWatch Agent" are the same thing. AWS Unified CloudWatch Agent is the latest version of the agent used to collect and send logs and metrics to Amazon CloudWatch.
Installation
- If your AMI contains a CloudWatch agent, it’s automatically installed on EC2 instances when you create an EC2 Auto Scaling group.
- With the stock Amazon Linux AMI, you need to install it (AWS recommends to install via yum).
- Ensure that an IAM Role with permissions to access CloudWatch is attached to the EC2 instances.
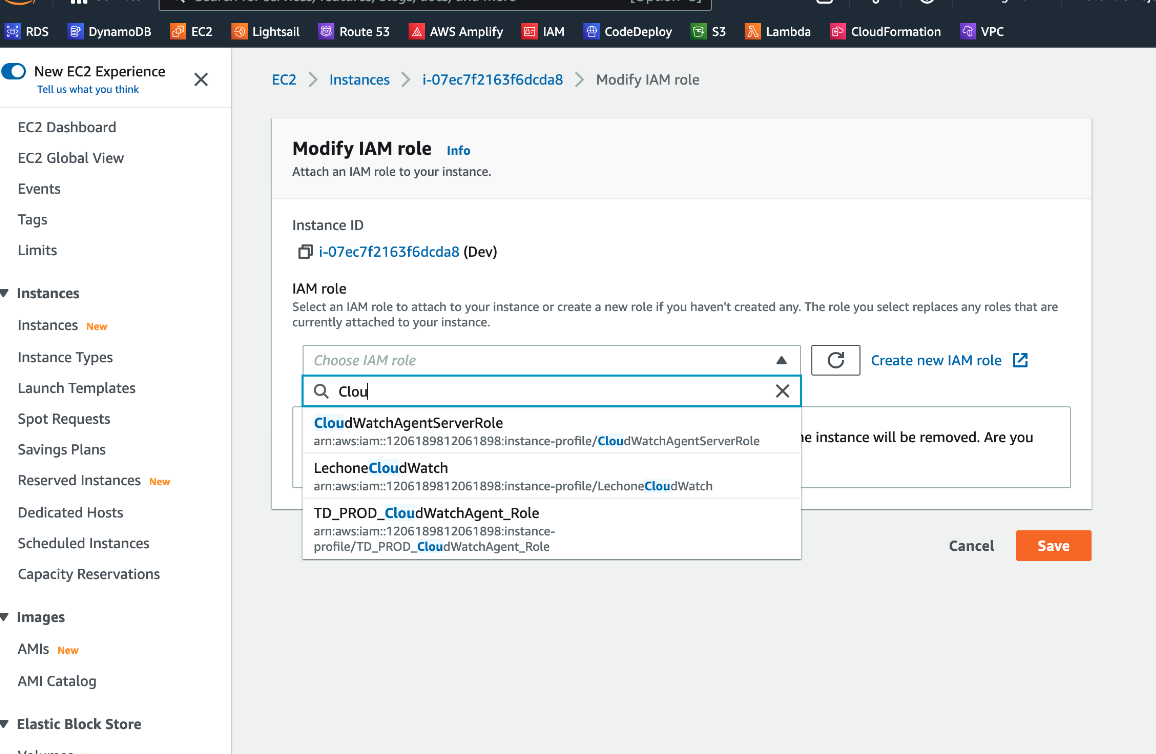
Permission
You must create and attach a IAM role to the EC2 instance to be able to run the CloudWatch agent on the instance. This role enables the CloudWatch agent to perform actions on the instance. In the screenshot, we have a role call CloudWatchAgentServerRole with below 4 essential policies:
{
"Version": "2012-10-17",
"Statement": [
    {
    "Effect": "Allow",
    "Action": [
        "logs:CreateLogGroup",
        "logs:CreateLogStream",
        "logs:PutLogEvents",
        "logs:DescribeLogStreams"
    ],
    "Resource": [
        "arn:aws:logs:*:*:*"
    ]
}
]
}
Features
Take note that there is no built-in “Memory Utilization” metric available in CloudWatch for EC2. You have to set up a custom metric to track the memory usage of your EC2 instances.
- Collect more system-level metrics from Amazon EC2 instances across operating systems. The metrics can include in-guest metrics in addition to the metrics for EC2 instances.
- Collect logs file to send to CloudWatch Logs (No logs from inside your EC2 instance will be sent to CloudWatch Logs without using an agent)
- Collect system-level metrics from on-premises servers. These can include servers in a hybrid environment as well as servers not managed by AWS.
- Retrieve custom metrics from your applications or services using the StatsD and collectd protocols.
StatsDis supported on both Linux servers and servers running Windows Server.collectdis supported only on Linux servers.
Other points:
- Use SSM Parameter Store to store the json format configuration that Unified CloudWatch Agent needs
- Make sure to attach an IAM role on the EC2 instance for accessing configuration from SSM
The appended option in configuration file
You can set up the CloudWatch agent to use multiple configuration files. For example, you can use a common configuration file that collects a set of metrics and logs that you always want to collect from all servers in your infrastructure. You can then use additional configuration files that collect metrics from certain applications or in certain situations.
To set this up, first create the configuration files that you want to use. Any configuration files that will be used together on the same server must have different file names. You can store the configuration files on servers or in Parameter Store.
Start the CloudWatch agent using the fetch-config option and specify the first configuration file. To append the second configuration file to the running agent, use the same command but with the append-config option. All metrics and logs listed in either configuration file are collected.
Any configuration files appended to the configuration must have different file names from each other and from the initial configuration file. If you use append-config with a configuration file with the same file name as a configuration file that the agent is already using, the append command overwrites the information from the first configuration file instead of appending to it. This is true even if the two configuration files with the same file name are on different file paths.